▷ Data visualization: of Temperature, Humidity, and CPU Temp.
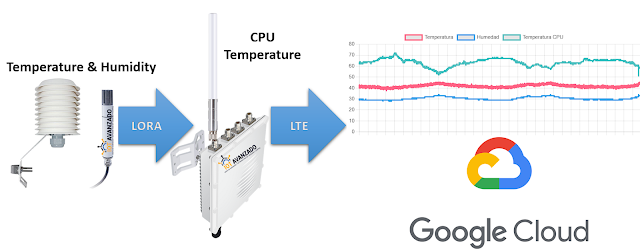
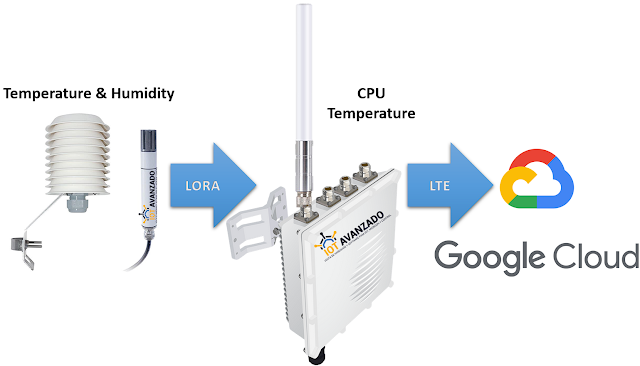
For this post, two sensors have been deployed for real-time data collection, currently operational in the city of Guayaquil: one for humidity and another for temperature. Both sensors utilize LoRA technology to transmit collected information to a Gateway. This Gateway serves as a central connection point, receiving data from the sensors and forwarding it to the Google Cloud platform via LTE cellular connectivity. Leaflet viewer with OpenStreetMap Leaflet viewer with OpenStreetMap Once the data is stored on the Google Cloud platform, a customized web interface has been developed. This interface facilitates the visualization and analysis of the sensor-collected data, offering users a clear and easily accessible representation. In this post, we'll explore how to visualize real-time data from Google Cloud using JavaScript and the powerful charting library, Chart.js. The goal is to create an interactive environment that visually and dynamically d...