Entradas

Mostrando las entradas de 2024

▷ Data visualization: of Temperature, Humidity, and CPU Temp.
Imagen
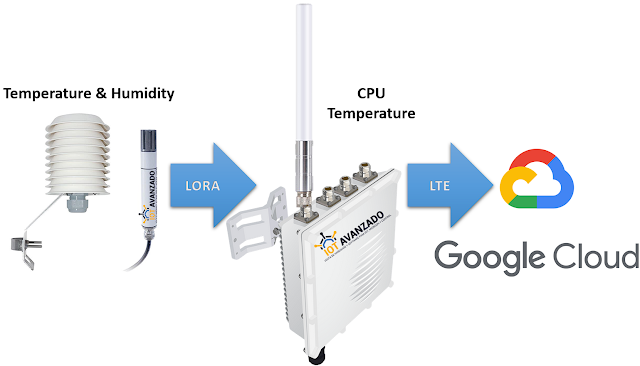
    For this post, two sensors have been deployed for real-time data collection, currently operational in the city of Guayaquil: one for humidity and another for temperature. Both sensors utilize LoRA technology to transmit collected information to a Gateway. This Gateway serves as a central connection point, receiving data from the sensors and forwarding it to the Google Cloud platform via LTE cellular connectivity. Leaflet viewer with OpenStreetMap Leaflet viewer with OpenStreetMap Once the data is stored on the Google Cloud platform, a customized web interface has been developed. This interface facilitates the visualization and analysis of the sensor-collected data, offering users a clear and easily accessible representation. In this post, we'll explore how to visualize real-time data from Google Cloud using JavaScript and the powerful charting library, Chart.js. The goal is to create an interactive environment that visually and dynamically displays va

▷ Display of last 24 hours of Temperature, Humidity and Temp. CPU

Imagen
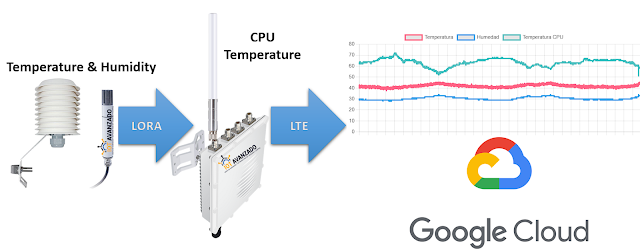
  For this post, two sensors have been deployed for real-time data collection, currently operational in the city of Guayaquil: one for humidity and another for temperature. Both sensors utilize LoRA technology to transmit collected information to a Gateway. This Gateway serves as a central connection point, receiving data from the sensors and forwarding it to the Google Cloud platform via LTE cellular connectivity. Leaflet viewer with OpenStreetMap Leaflet viewer with OpenStreetMap Once the data is stored on the Google Cloud platform, a customized web interface has been developed. This interface facilitates the visualization and analysis of the sensor-collected data, offering users a clear and easily accessible representation. In today's interconnected world, the ability to gather and visualize real-time data is essential for understanding and making informed decisions. On this occasion, we will explore how to visualize the data from the last 24 h

▷ Wireless Sensor Network (WSN)

Imagen
Wireless Sensor Network (WSN), based on Internet of Things (IoT) applications, has transformed the way farmers manage their daily operations and significantly enhanced strategic productivity in the agricultural sector. This groundbreaking technology enables wireless connectivity among sensors scattered in the field, creating an intelligent network that provides real-time data for various key applications. One of the standout applications is the smart irrigation system, where sensors collect data on soil moisture and weather conditions. This data is used to optimize irrigation patterns, ensuring efficient water use and maximizing crop growth. Furthermore, WSN facilitates monitoring parameters such as soil moisture, temperature, evapotranspiration (ET) in the agricultural environment, allowing farmers to take swift action upon detecting contaminants or unfavorable conditions for production. Another important application is indoor positioning, aiding farmers in tracking and managing asset